You woke up, grabbed your thermometer, said good morning to anyone, took your temperature, wrote it down, and now you are staring at a chart full of tiny numbers, wondering what any of it actually means.
Learning how to read a basal body temperature chart is one of those things that sounds complicated at first, but clicks surprisingly fast once someone breaks it down clearly. That is exactly what this guide does, step by step, in plain English.
You are not alone in feeling confused. Thousands of American women start BBT charting with total dedication, only to hit a wall when it comes to interpreting what their charts are showing them. This guide fixes that.
What Is a BBT Chart?
Your basal body temperature (BBT) is your body's resting temperature, the lowest it reaches during the day, measured right after waking before you move an inch.
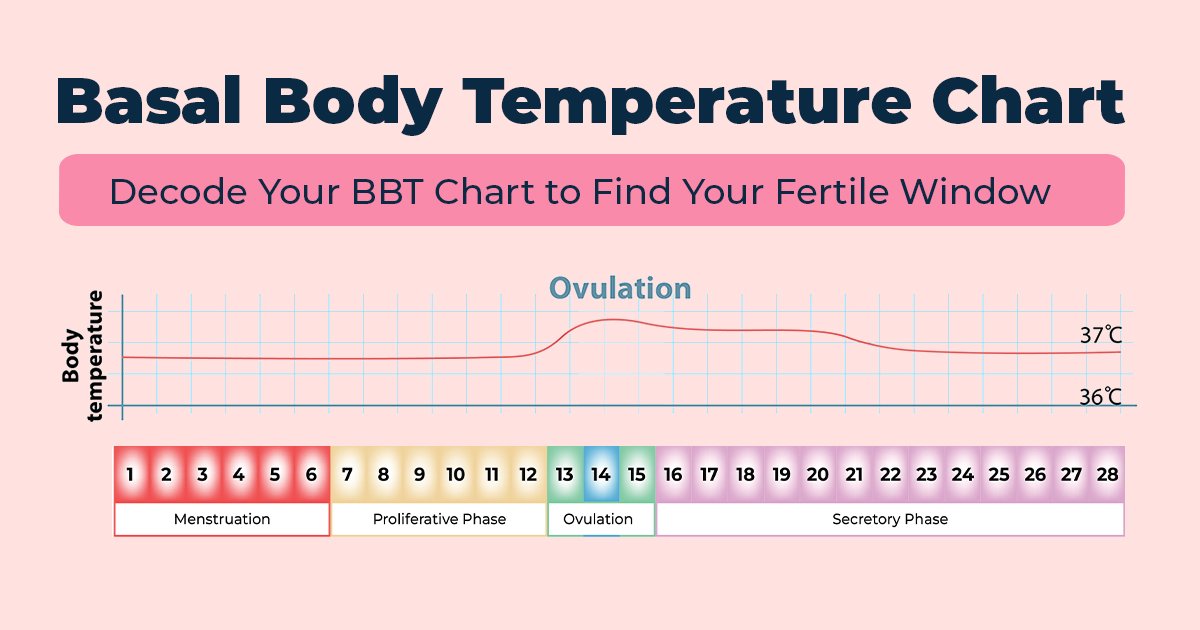
During your cycle, hormones cause your BBT to dip slightly before ovulation, then rise and stay elevated after your egg is released. Recording that number every morning and plotting it on a chart creates a visual map of your cycle, one that tells you when you ovulate and, over time, when your fertile window is likely to open.
A normal BBT chart shows a consistent rise of about 0.5°F after ovulation. That rise is your body saying, "The egg has been released."
If you want a structured way to build this habit from day one, the ConceiveLife 90-Day Fertility Tracker is designed to help women track consistently over a meaningful period.
Step 1: Get the Right Thermometer
A standard fever thermometer won't work here. BBT thermometers are far more sensitive; they read to two decimal places, showing 98.15°F instead of just 98.1°F. That extra precision matters because the shift you're looking for is just fractions of a degree. You can find one at most drugstores for around $10.
Keep it on your nightstand. The goal is to reach for it before you sit up, talk, or even drink water.
Step 2: Take It at the Same Time Every Morning
Consistency is everything. Take your temperature as soon as you wake up, before you stand up, and at the same time each day. Sleeping in even an extra hour can push your reading up and distort the pattern you're trying to see.
Aim for at least three consecutive hours of sleep before measuring. Had a rough night, drank alcohol, or felt stressed? Just note it next to that day's reading. You're not erasing data, you're giving it context.
Step 3: Log It Every Single Day
Write your temperature down every morning without fail. Use a paper chart, a spreadsheet, or a fertility app, whatever you'll actually stick with. Apps like Premom, Flo, and Fertility Friend will auto-plot your readings and make patterns easier to see.
Don't read too much into individual numbers. One weird temperature on Day 9 means almost nothing. The pattern across your full cycle is what tells the real story.
Step 4: Understand the Two Phases
This is the concept that makes everything else make sense.
Before ovulation, your BBT sits in a lower, stable range. After ovulation, it rises and stays elevated. This two-phase shape is called a biphasic pattern; think of it as a valley followed by a hill. The valley is your follicular phase. The hill is your luteal phase. The climb between them? That's ovulation.
This happens because after ovulation, your body releases progesterone, a hormone that raises your resting temperature. Since progesterone only spikes after ovulation, the temperature rise is essentially your body's confirmation that it happened.
Step 5: Spot the Thermal Shift
The thermal shift is the moment your temperature jumps from the low zone into the high zone. It's the most important signal on your chart.
Look for at least three consecutive days with higher temperatures than the previous six days. A typical shift is 0.4 to 1.0°F. One high day isn't enough; three in a row confirm it.
Step 6: Draw Your Coverline
Once you spot the shift, draw a coverline, a horizontal line separating your low-temperature days from your high-temperature days. It makes the biphasic pattern instantly visible.
To draw it using the "three over six" method: look at the six days before your temperature rise. Take the highest reading from those six days and draw your line 0.1°F above it. When three consecutive temperatures fall above that line, ovulation is confirmed.
Don't overthink it. The coverline is a visual aid, not a medical test.
Step 7: Find Your Fertile Window
Here's the truth: BBT charting confirms ovulation after it's already happened. By the time your temperature rises, the egg has been released.
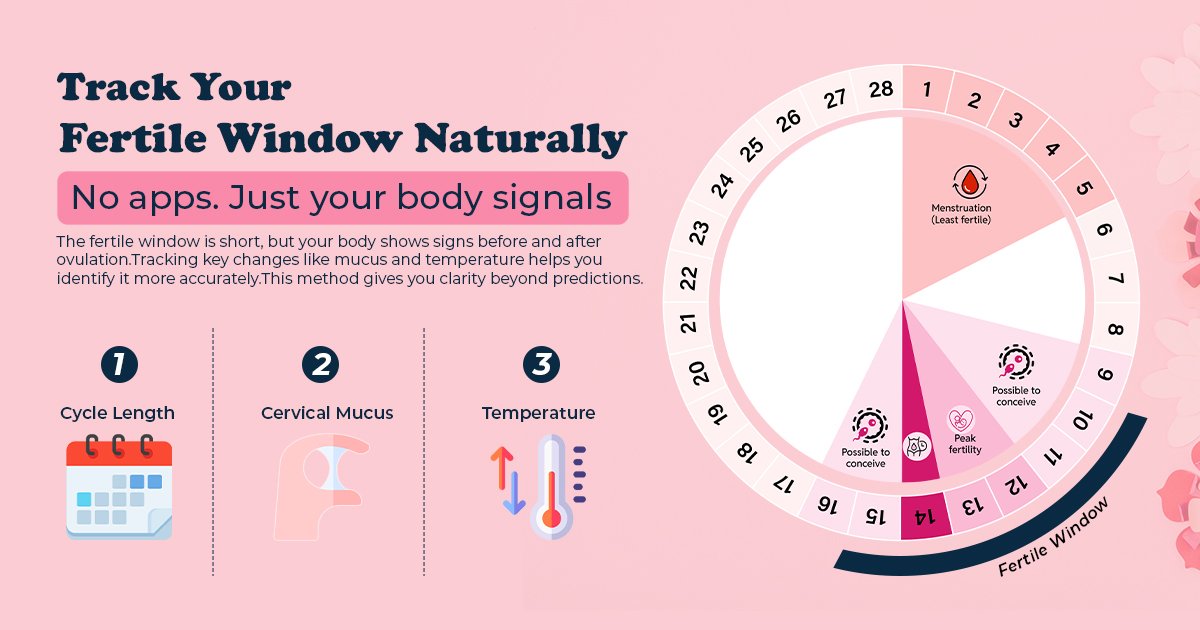
So how does it help you conceive? Over multiple cycles, you'll notice a pattern: "my temperature rises around Day 14." That lets you time things in future cycles, because your most fertile window opens two to five days before that expected rise. Sperm can live inside the body for up to five days, so getting ahead of the shift is the goal.
This is why most doctors recommend tracking for at least three cycles before relying on the data. Not sure where to start? ConceiveLife's free fertility assessment helps you understand your individual cycle picture before you even pick up a thermometer.
Key Patterns to Watch For
After a few cycles, step back and look at the bigger picture.
Healthy chart: Temps stay low and relatively steady in the first half, shift clearly upward after ovulation, then stay elevated throughout the luteal phase.
Possible pregnancy sign: Temps that stay high for more than 15 to 16 days after ovulation, with no period arriving, are worth taking a pregnancy test over.
Short luteal phase: Your post-ovulation high-temp phase should last 12 to 14 days. Fewer than 10 days consistently is worth discussing with your doctor.
No biphasic pattern: A flat chart with no clear shift across multiple cycles may indicate you're not ovulating. Bring those charts to your OB-GYN.
What BBT Charting Can and Can't Do
Once you know how to read a basal body temperature chart, you stop feeling like you are guessing every month. You start seeing your cycle as information, not a mystery. Your chart becomes a tool you actually trust.
Pair BBT with ovulation predictor kits (OPKs) and cervical mucus tracking for the most complete picture. And if you want everything in one place, tools, tracking, and real support, ConceiveLife brings it all together in a way that makes fertility tracking feel less overwhelming and a lot more empowering.
Quick FAQs
What's a normal pre-ovulation BBT?
Between 97.0 and 97.7°F for most women, rising to 97.7 to 99.0°F after ovulation.
Can illness mess up my chart?
Yes — note it next to that day's reading and keep going. One disrupted reading doesn't ruin your data.
Does alcohol affect BBT?
It does. Alcohol raises resting temperature, so note it on any morning after.
When should I see a doctor?
If you see no biphasic pattern across three or more cycles, a consistently short luteal phase, or you've been trying to conceive for 12 months (6 months if you're over 35), bring your charts to your provider. They're a great conversation starter.